Skip to content
  • 04:37
  • Wednesday
  • 21. April 2021
  • Home
  • About me
  • Contact

Christoph Pfeiffer

Latest
Building a macro-sentiment indicator with Python  |  
Statistically sound backtesting of trading strategies  |  
Financial situation of municipalities in North Rhine-Westphalia, Germany  |  
Dynamic charts with googleVis  |  
Visualization of long- and short term stock movements  |  
A quick look at the composition of terrorist events  |  
Toda-Yamamoto implementation in ‘R’  |  
Quantifying attention to terrorism: Google searches vs. NYT  |  
Building a macro-sentiment indicator with Python
4. January 2018 Christoph

The idea of a macro-sentiment indicator is to monitor macro data and sentiment data at the same time. The idea is straightforward. Divergence between macro and sentiment data can generate a signal. For example, good macro data and bad sentiment would generate a buy signal. Bad macro data and good sentiment data generates a sell […]

Read More
Predictions / Trading / Visualisations
Statistically sound backtesting of trading strategies
1. April 2014 Christoph

In this series of posts I will look at some aspects of backtesting trading strategies. The posts are based on David Aronson’s book Evidence-Based Technical Analysis.

Read More
Trading
Financial situation of municipalities in North Rhine-Westphalia, Germany
13. November 2013 Christoph

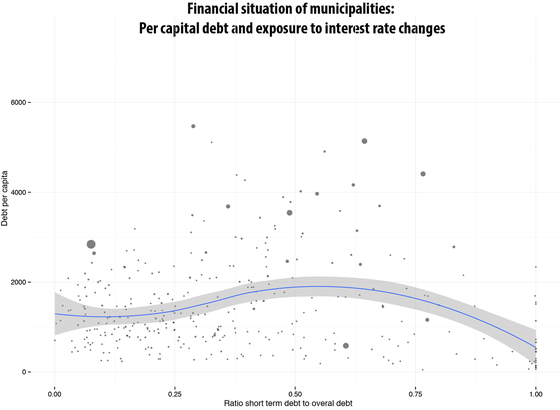
The financial situation of municipalities is often dire. North Rhine-Westphalia, Germany’s biggest state, is generally thought to be in the worst financial situation. High per capita debt is often accompanied by a high share of short-term debt which strongly exposes the municipalitiy to interest rate risk.

Read More
Predictions / Trading / Visualisations
Dynamic charts with googleVis
22. May 2013 Christoph

Dynamic charts are a nice way to visualize patterns over time. With the googleVis package this kind of graph has become easy to create. In this post, I will use the googleVis package to create two interactive moving bubble charts from the Global Terrorism Database (GTD).  

Read More
Other / Predictions / Trading / Visualisations
Visualization of long- and short term stock movements
30. March 2013 Christoph

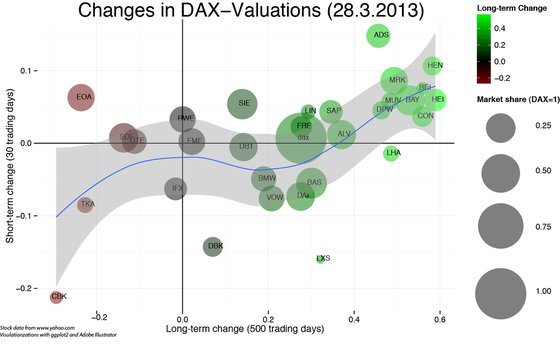
Aim In this post I will explore, how correlations between long- and short-term stock movements can be visualized using R and ggplot2. I will look at the current German composite index DAX, but any other set of stocks–for which data are available–is feasible.   

Read More
Other / Predictions / Trading / Visualisations
A quick look at the composition of terrorist events
10. March 2013 Christoph

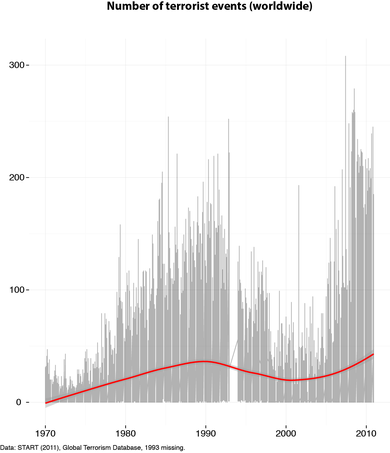
In this blog entry, I will use data from the Global Terrorism Database to briefly explore some aspects of how the composition of terrorist events has changed over time.  

Read More
Other / Predictions / Trading / Visualisations
Toda-Yamamoto implementation in ‘R’
7. November 2012 Christoph

When it comes to causality tests, the typical Granger-causality test can be problematic. Testing for Granger-causality using F-statistics when one or both time series are non-stationary can lead to spurious causality (He & Maekawa, 1999).    Professor Giles gives an excellent example of how the TY method can be implemented.   More formal explanations can be […]

Read More
Other / Predictions / Trading / Visualisations
Quantifying attention to terrorism: Google searches vs. NYT
5. November 2012 Christoph

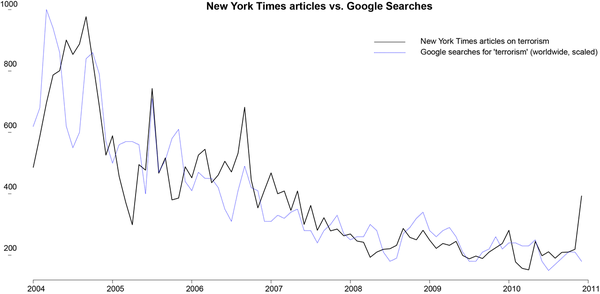
Empirical contributions that focus on terrorism and its reception by the media face the fundamental difficultly of quantifying media coverage of terrorism, which has led to a relatively thin body of empirical research on the subject:  

Read More
Other / Predictions / Trading / Visualisations
About Me

Game Theorist, data scientist entrepreneur and book author with a focus on negotiations, NLP and deep learning.

Read more.

Categories
  • Other (5)
  • Predictions (7)
  • Trading (8)
  • Visualisations (7)
Recent Posts
  • Building a macro-sentiment indicator with Python
  • Statistically sound backtesting of trading strategies
  • Financial situation of municipalities in North Rhine-Westphalia, Germany
  • Dynamic charts with googleVis
  • Visualization of long- and short term stock movements
Proudly powered by WordPress | Theme: news-box by wpthemespace.com.
  • Home
  • About me
  • Contact
  • Privacy Policy