The idea of a macro-sentiment indicator is to monitor macro data and sentiment data at the same time. The idea is straightforward. Divergence between macro and sentiment data can generate a signal. For example, good macro data and bad sentiment would generate a buy signal. Bad macro data and good sentiment data generates a sell […]
Author: Christoph

Statistically sound backtesting of trading strategies
In this series of posts I will look at some aspects of backtesting trading strategies. The posts are based on David Aronson’s book Evidence-Based Technical Analysis.
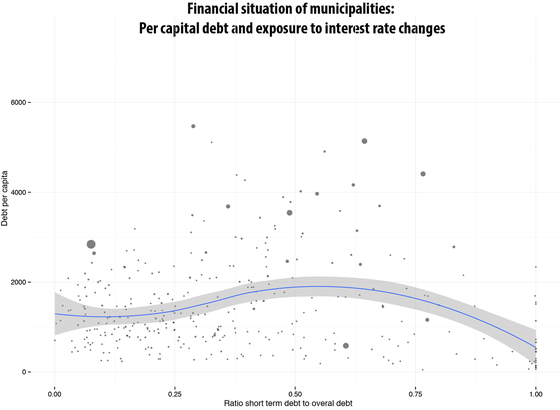
Financial situation of municipalities in North Rhine-Westphalia, Germany
The financial situation of municipalities is often dire. North Rhine-Westphalia, Germany’s biggest state, is generally thought to be in the worst financial situation. High per capita debt is often accompanied by a high share of short-term debt which strongly exposes the municipalitiy to interest rate risk.
Dynamic charts with googleVis
Dynamic charts are a nice way to visualize patterns over time. With the googleVis package this kind of graph has become easy to create. In this post, I will use the googleVis package to create two interactive moving bubble charts from the Global Terrorism Database (GTD).
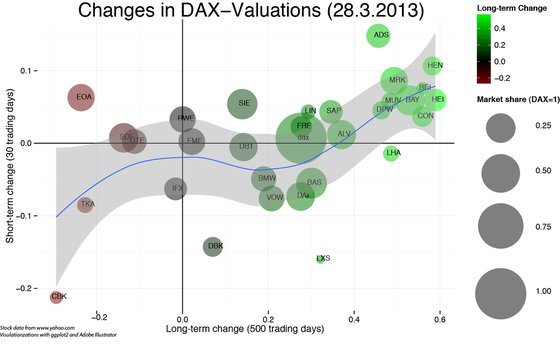
Visualization of long- and short term stock movements
Aim In this post I will explore, how correlations between long- and short-term stock movements can be visualized using R and ggplot2. I will look at the current German composite index DAX, but any other set of stocks–for which data are available–is feasible.
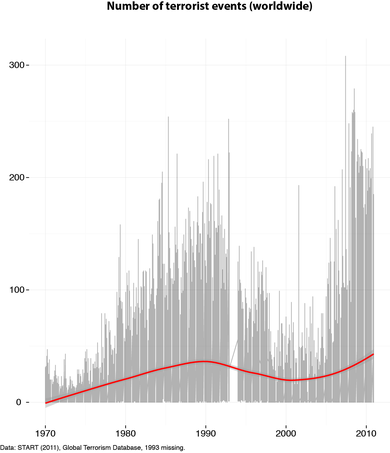
A quick look at the composition of terrorist events
In this blog entry, I will use data from the Global Terrorism Database to briefly explore some aspects of how the composition of terrorist events has changed over time.
Toda-Yamamoto implementation in ‘R’
When it comes to causality tests, the typical Granger-causality test can be problematic. Testing for Granger-causality using F-statistics when one or both time series are non-stationary can lead to spurious causality (He & Maekawa, 1999). Professor Giles gives an excellent example of how the TY method can be implemented. More formal explanations can be found in […]
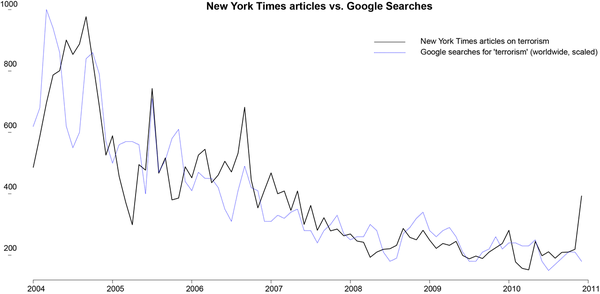
Quantifying attention to terrorism: Google searches vs. NYT
Empirical contributions that focus on terrorism and its reception by the media face the fundamental difficultly of quantifying media coverage of terrorism, which has led to a relatively thin body of empirical research on the subject: