When it comes to causality tests, the typical Granger-causality test can be problematic. Testing for Granger-causality using F-statistics when one or both time series are non-stationary can lead to spurious causality (He & Maekawa, 1999). Professor Giles gives an excellent example of how the TY method can be implemented. More formal explanations can be found in […]
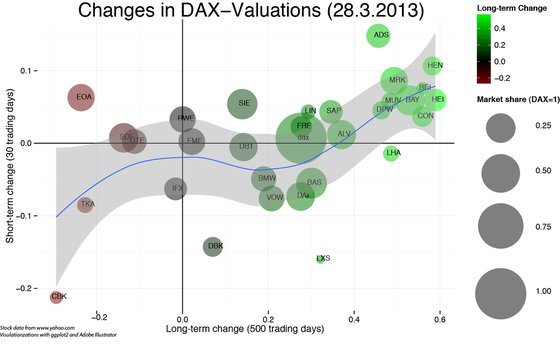
Visualization of long- and short term stock movements
Aim In this post I will explore, how correlations between long- and short-term stock movements can be visualized using R and ggplot2. I will look at the current German composite index DAX, but any other set of stocks–for which data are available–is feasible.