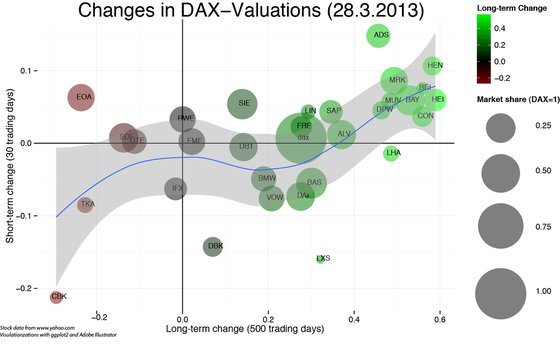
Visualization of long- and short term stock movements
Aim In this post I will explore, how correlations between long- and short-term stock movements can be visualized using R and ggplot2. I will look at the current German composite index DAX, but any other set of stocks–for which data are available–is feasible.