When it comes to causality tests, the typical Granger-causality test can be problematic. Testing for Granger-causality using F-statistics when one or both time series are non-stationary can lead to spurious causality (He & Maekawa, 1999). Professor Giles gives an excellent example of how the TY method can be implemented. More formal explanations can be found in […]
Dynamic charts with googleVis
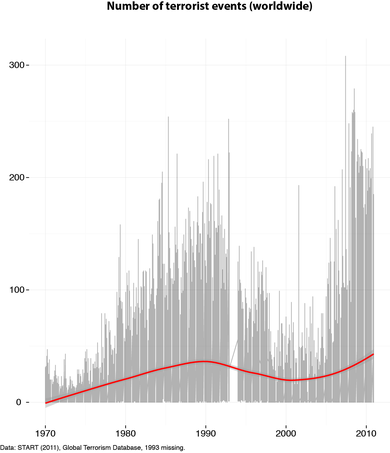
Dynamic charts are a nice way to visualize patterns over time. With the googleVis package this kind of graph has become easy to create. In this post, I will use the googleVis package to create two interactive moving bubble charts from the Global Terrorism Database (GTD).


